
Aortic Valve Area: Grading Stenosis Severity
Understand aortic valve area severity and how doctors grade mild, moderate and severe aortic stenosis.
If you or a family member has been told you have aortic stenosis — a narrowing of the heart's main outflow valve — the report probably mentions a number in square centimetres. That number is the aortic valve area, and understanding aortic valve area severity is the single clearest way to know how advanced the condition is and what should happen next. This guide walks through the normal ranges, the grading stages, how the measurement is actually taken, and the treatment thresholds doctors use to decide between monitoring, surgery and transcatheter options.
What Is Aortic Valve Area Severity?
The opening valve. The aortic valve sits between the left ventricle — the heart's main pumping chamber — and the aorta, the large artery that carries blood to the whole body. Every heartbeat pushes blood through this valve. In a healthy adult, the leaflets open wide and blood flows freely. In aortic stenosis, calcium builds up on the leaflets over years, so they stiffen and the opening narrows.
Why the number matters. Aortic valve area severity describes how much physical space is left for blood to pass through. A smaller area means the heart must squeeze harder to push the same amount of blood through a tighter gap. Over time, that extra work thickens and weakens the heart muscle, which is what eventually causes breathlessness, chest discomfort, dizziness and fainting.
A decision-making tool. Cardiologists do not treat stenosis based on symptoms alone. The measured area, together with the pressure gradient across the valve and the pumping function of the heart, places each patient into a severity stage — and that stage drives every downstream decision, from yearly monitoring to intervention. Our team reviews every case against international practice guidelines before making a recommendation, and the patient always receives the alternatives in plain language.
What Is a Normal Aortic Valve Area Range?
The normal aortic valve area range in an adult is roughly 2.5 to 3.5 square centimetres. At that size, the valve offers almost no resistance to flow, and blood moves through it at a modest speed — usually under about 2 metres per second on an ultrasound scan. Anything meaningfully below this range suggests some degree of narrowing.
It helps to picture a doorway. A normal valve is a wide-open double door. Mild stenosis is like a door held slightly ajar — flow still passes easily at rest. Severe stenosis is a door left open only a crack, forcing everyone to squeeze through. The heart can compensate for a while, but the effort shows up eventually as symptoms.
Keep in mind that the exact number on your report is one piece of information, not a verdict. Body size, the way the heart pumps, and other valve conditions all influence how a given area should be interpreted. That is why the report is read together with your whole clinical picture rather than a single figure.
How Is the Aortic Valve Area Measured on an Echocardiogram?
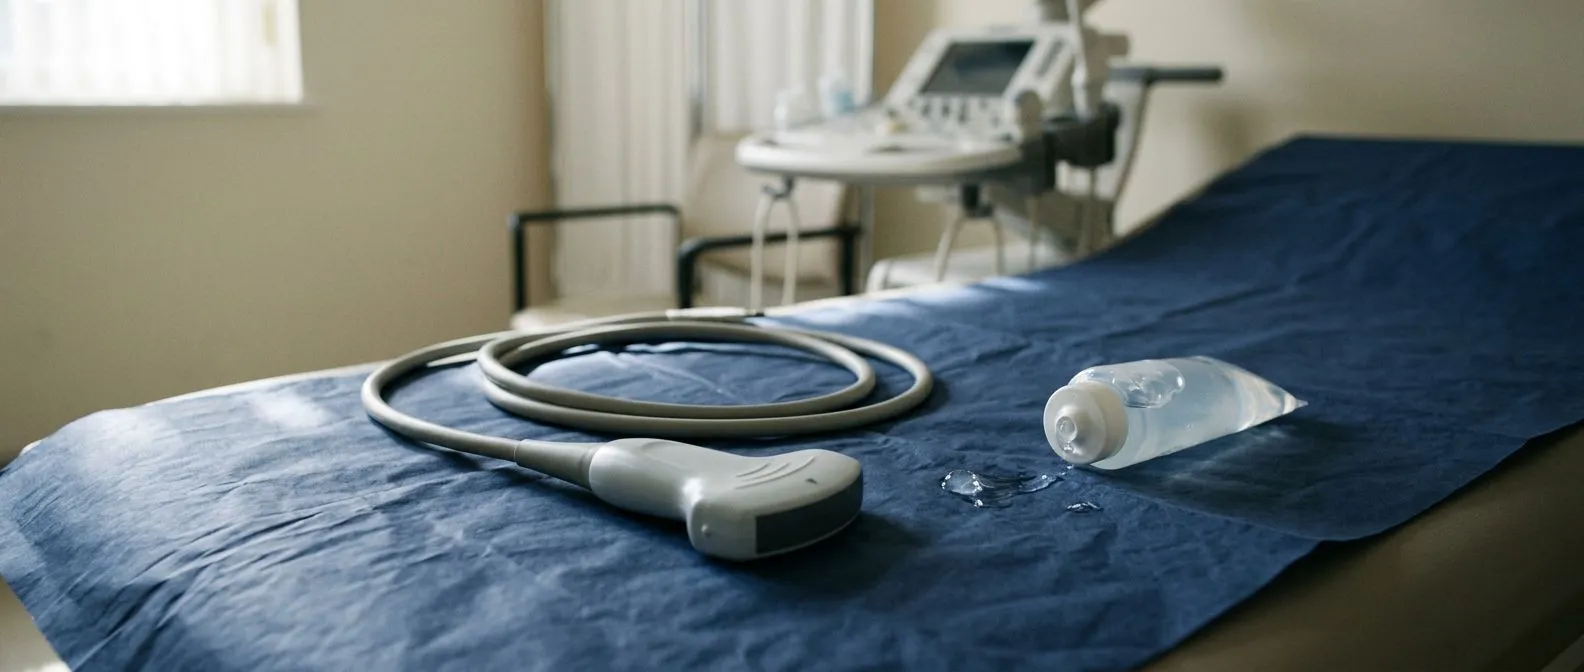
The standard first test. The aortic valve area is almost always measured with transthoracic echocardiography — an ultrasound scan of the heart done with a probe pressed on the chest. It takes no preparation, involves no radiation, and takes about 30 to 45 minutes. The probe sends sound waves through the chest wall, and the returning echoes are used to map the valve and measure blood flow.
How the flow is measured. Doppler ultrasound tracks the speed of blood crossing the valve. The faster the blood, the tighter the opening — much like putting your thumb over a garden hose. The scanner measures the peak velocity and the mean pressure gradient, which is the average pressure difference between the pumping chamber and the aorta. Together with the calculated area, these numbers form the echocardiographic picture of severity.
Why the same scan can differ between centres. Echocardiography is operator-dependent: the angle of the probe, the quality of the ultrasound window, and the calcification itself all affect the result. In our practice we take the time during consultation to explain exactly what the studies actually show, in plain words, so patients understand their own numbers before any decision is made. When the echocardiogram is borderline or unclear, we confirm with a second imaging method rather than guess.
How Does the Aortic Valve Area by Continuity Equation Work?
The aortic valve area by continuity equation is the standard calculation used on every echocardiogram. It relies on a simple physical principle: whatever volume of blood leaves the left ventricle in one beat must pass through the narrowed valve. By measuring flow in a region of known size — the left ventricular outflow tract — and comparing it with the flow speed at the valve itself, the scanner calculates the effective opening.
In simplified terms, the equation multiplies the outflow tract's diameter-derived area by the flow velocity there, and divides by the peak velocity through the valve. The result is called the "effective" valve area, because the jet of blood contracts slightly as it passes through the stiffened opening. It is a derived number, not a direct photograph of the valve.
Because it depends on several measurements, small errors compound. An outflow tract diameter measured a couple of millimetres short can make the valve look tighter than it is. This is one reason guidelines recommend confirming severity when the numbers and the symptoms do not agree — and why an experienced team re-measures before labelling a valve "severe".
Aortic Valve Area Grading: What Are the Mild, Moderate and Severe Stages?
Aortic valve stenosis classification follows internationally agreed cut-offs. Doctors look at three paired numbers: the valve area, the peak flow velocity, and the mean pressure gradient. The combination — not any single number — defines the stage. The table below summarises the usual thresholds.
- Normal: valve area above 2.0 cm², velocity under about 2 m/s, negligible gradient.
- Mild aortic valve stenosis criteria: area roughly 1.5–2.0 cm², velocity 2.0–2.9 m/s, mean gradient under 20 mmHg.
- Moderate aortic stenosis grading: area roughly 1.0–1.5 cm², velocity 3.0–3.9 m/s, mean gradient 20–39 mmHg.
- Severe aortic stenosis valve area: area 1.0 cm² or less, velocity 4.0 m/s or more, mean gradient 40 mmHg or more.
Why the stages matter. Mild stenosis is usually watched with periodic echocardiograms — often yearly or every few years. Moderate stenosis calls for closer surveillance, typically every one to two years, because valves can progress. Severe stenosis changes the conversation entirely: treatment options are discussed, especially once symptoms appear. Severe aortic stenosis with symptoms is one of the clearest indications for valve intervention in cardiology.
The gradings are guidelines, not walls. A patient with an area of 1.1 cm² but strong symptoms and a sluggish heart may be treated as functionally severe. Another with 0.9 cm² but no symptoms and normal pumping may simply be monitored closely. Context always shapes the plan.
When Is Aortic Stenosis Considered Severe Enough to Treat?
The classic threshold. An area of 1.0 cm² or less, with a mean gradient of 40 mmHg or more, defines severe aortic stenosis in the standard sense. When those numbers are present and the patient has symptoms — breathlessness on effort, chest tightness, dizziness or fainting — guidelines recommend valve replacement, because the outlook without treatment worsens considerably once symptoms begin. Severe Aortic Stenosis is the condition most often discussed in this setting.
Severe but symptom-free. Severe stenosis can exist before symptoms do. In that situation, doctors look at extra markers: whether the heart muscle is starting to show strain, whether the pumping function is declining, whether exercise testing brings symptoms out, or whether the valve is very heavily calcified. Some asymptomatic severe patients are still offered intervention based on these findings.
Individual factors. Age, other valve disease, coronary artery disease, kidney function and overall fitness all influence the timing and the type of intervention. In our multidisciplinary team, led by Dr Alejandro Molina with consulting rooms in Guadalajara, Querétaro and Hermosillo, every case is reviewed together against international guidelines before a proposal is made — and the final decision always rests with the patient.

What Is Low-Gradient Aortic Stenosis and Pseudonormal Valve Area?
When the numbers disagree. Some patients have a valve area that looks severe — around 1.0 cm² or less — but the pressure gradient is lower than expected, meaning the heart is not generating much force. This is called low-gradient aortic stenosis valve area territory, and it splits into two situations: genuinely severe stenosis with a weak pumping chamber, or "pseudo-severe" stenosis where the valve is not truly that tight.
Why the heart matters so much. When the left ventricle weakens, it cannot generate high pressure across even a genuinely narrowed valve. The gradient looks reassuring but the valve may still be critically tight. Distinguishing these situations requires additional testing — commonly a low-dose medication infusion during echocardiography (a "dobutamine stress echo") that makes the heart beat harder and reveals the valve's true opening.
Pseudonormal aortic valve area. The opposite trap also exists: certain conditions, such as significant leak through the aortic valve (aortic insufficiency) or a small, stiff heart, can make the calculated area look falsely reassuring. This is why no single number is ever treated as final. Where the picture is unclear, we confirm severity with a second imaging method — CT or transoesophageal echo — before recommending anything, because treating a valve that is not truly severe carries risk without benefit.
What About CT Planimetry and the Velocity Ratio?
Computed tomography (CT) offers a direct way to see the valve. In CT planimetry, the scanner reconstructs the open valve in three dimensions and the narrowest opening is traced directly — an actual measurement of the physical hole, not a flow-based calculation. This is especially useful when echocardiographic numbers are borderline, when calcification distorts the Doppler signal, or when low-gradient situations need clarification.
The velocity ratio is another cross-check. It compares the flow speed in the outflow tract just below the valve with the flow speed through the valve itself. Because both speeds are measured in the same patient with the same machine, many of the technical errors cancel out. A ratio at or below 0.25 supports severe stenosis even when the absolute numbers are uncertain.
These tools are complementary, not competing. A typical confirmation pathway uses echocardiography first, then CT planimetry or a stress echo when the picture is muddy. The published comparisons between CT and Doppler measurements of the aortic valve area — for example, research indexed in Europe PMC — show the two methods generally agree, each with its own sources of small error.
How Quickly Does Aortic Stenosis Get Worse?
The usual pace. For most older adults with calcium degeneration, stenosis progresses gradually: the valve area typically shrinks by roughly 0.1 cm² per year, and velocity climbs by a few tenths of a metre per second per year on average. Progression is faster in some patients than others, which is why the follow-up interval is tailored rather than fixed.
Factors that speed it up. A bicuspid aortic valve — a congenital valve formed of two leaflets instead of three — tends to stiffen earlier and faster. The abnormal flow patterns in bicuspid valves also affect the aorta itself; studies of elastin degradation in bicuspid patients, such as work published through Atlantis Press, show distinct patterns of aortic wall damage in these patients. Diabetes, kidney disease, high blood pressure, smoking and high cholesterol are also associated with faster progression.
The follow-up rhythm. A practical schedule is: mild stenosis reviewed every 3–5 years, moderate stenosis every 1–2 years, and severe stenosis every 6–12 months, sooner if symptoms change. We also encourage a second opinion at any point where a patient feels uncertain — we treat seeking one as a completely normal part of deciding about heart surgery, and our free first video consultation exists precisely so patients can talk through their studies before committing to anything.
Treatment Thresholds: When Is Aortic Valve Replacement or TAVR Recommended?
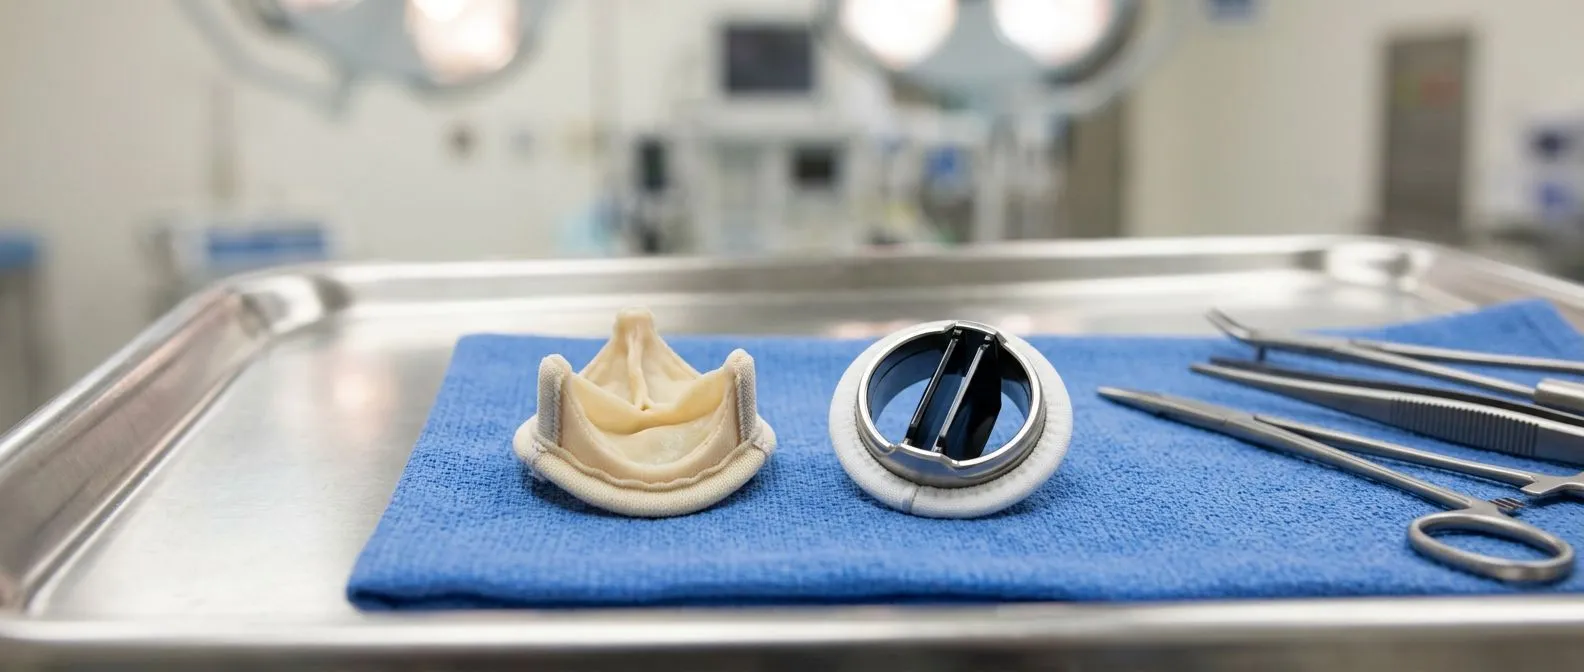
The two main routes. When severe stenosis needs treatment, there are two established paths. Surgical Aortic Valve Replacement opens the chest — through a full sternotomy or a smaller minimally invasive incision — and replaces the valve directly. Transcatheter Aortic Valve Implantation, universally called TAVR, threads a new valve to the heart through a catheter, usually from an artery in the groin, without opening the chest.
Choosing between them. Age, valve anatomy, artery health, and prior chest surgery all tilt the balance. TAVR was first proven in patients too frail for open surgery, and it is now an accepted option for many others. Device technology keeps improving — repositionable systems such as the one studied in the REPRISE II trial were developed specifically to give operators more control during implantation. Younger patients with otherwise healthy anatomy are often better served by durable surgical valves; older or higher-risk patients often benefit from TAVR. We perform conventional, minimally invasive, robotic and transcatheter procedures, and we recommend the less invasive route only where the evidence supports it for that specific patient.
What happens next. Once a decision to treat is made, the work-up maps the valve, the arteries and the access route, and the team proposes the plan with its alternatives. Recovery differs markedly: transcatheter patients often go home within a few days, while surgical patients need several weeks. Our own trajectory includes robotic milestones — Dr Molina performed the first robotic mitral valve repair in the Ángeles Health System and the first robotic heart surgery in Guadalajara — but the technology chosen is always the one that fits the patient, not the machine.
Bringing it together. Understanding aortic valve area severity turns a confusing report into a clear map: a normal range of roughly 2.5–3.5 cm², mild at 1.5–2.0 cm², moderate at 1.0–1.5 cm², and severe at 1.0 cm² or less — always read alongside velocity, gradient and symptoms. If your echocardiogram shows a narrowing valve, the most valuable next step is not self-diagnosis but a conversation with a qualified cardiac team who can explain your specific numbers, confirm them where needed, and lay out every option. You can book a free video consultation with our team to review your studies and discuss what they mean — no tests are ordered that you do not need, and the decision about any treatment remains entirely yours.