


ECG Results Explained: What Your Heart Tracing Shows
Get ECG results explained by Guadalajara heart specialists.
What Are ECG Results and Why Do They Matter?
When your doctor hands you a printout from an electrocardiogram, you may find yourself staring at a series of squiggly lines and wondering what they reveal about your heart. Having ECG results explained in plain language can ease the anxiety that comes with any cardiac test. An electrocardiogram — often called an ECG or EKG — records the electrical activity of your heart through small sensors placed on your chest, arms, and legs. The tracing that appears on graph paper is a visual record of how your heart's electrical system fires with each beat.
You might receive an ECG as part of a routine check-up, before surgery, or because you reported symptoms such as chest tightness, shortness of breath, or arm pain that radiates from the chest. For many patients, the ECG is the first diagnostic step in understanding whether symptoms come from the heart or another cause entirely. The results can reveal rhythm disturbances, signs of reduced blood flow, evidence of previous heart damage, or structural concerns — sometimes before you feel any symptoms at all.
It is natural to feel unsettled when you see unfamiliar medical terms on a report. The goal of this guide is to walk you through what each part of the tracing means, how cardiologists interpret the findings, and what steps make sense if something looks unusual. Rather than replacing a conversation with your own cardiac team, this information helps you arrive at that conversation better prepared and more confident about what your ECG results mean for you.
How Does an ECG Work to Trace Your Heart?
Your heart runs on electricity. A specialised cluster of cells called the sinoatrial node generates an electrical impulse roughly 60 to 100 times per minute at rest. That signal spreads through the atrium — the upper receiving chamber of the heart — and then travels down to the ventricles, the main pumping chambers. The ECG captures this electrical journey as it moves across the heart muscle, translating it into the wave pattern you see on paper.
The test itself takes only a few minutes. A technician attaches sticky patches called electrodes to specific points on your torso and limbs — typically six on the chest and one on each arm and leg. These electrodes detect the tiny electrical changes that occur with each heartbeat and send them to a machine that draws the tracing. According to the National Heart, Lung, and Blood Institute, an ECG is one of the simplest and fastest tests available for evaluating heart function, and it carries no radiation exposure. You simply lie still and breathe normally while the machine records.
What the patient actually experiences: The procedure is painless and non-invasive — you will not feel the electrical signals being measured, because the equipment only reads what your heart is already doing. Some people with sensitive skin notice slight irritation when the electrode patches are removed, similar to pulling off a bandage. The tracing is produced instantly, and in many clinics a cardiologist can review and discuss the initial findings with you before you leave the examination room.
What Does a Normal ECG Look Like?
A normal ECG tracing follows a recognisable pattern that repeats with each heartbeat. When cardiologists describe a tracing as normal, they mean the electrical signals are following the expected pathway through the heart at the expected speed, with no evidence of damage, strain, or dangerous rhythm changes. The standard printout runs across graph paper at 25 millimetres per second, and each small square represents a specific fraction of time and voltage that allows precise measurement of the heart's activity.

What counts as normal can vary slightly from person to person. Heart rate naturally differs between individuals, and athletes often have resting heart rates below 60 beats per minute that would seem unusual in a non-athlete but are perfectly healthy for them. Age, medications, and body habitus all influence what your personal baseline looks like. This is why cardiologists compare your tracing against established reference ranges rather than a single ideal pattern when determining whether your ECG results fall within normal limits.
It is also worth knowing that a normal ECG does not rule out every heart problem. The tracing captures a snapshot of electrical activity over a few seconds, so conditions that come and go — such as intermittent arrhythmias — may not appear during the brief recording. If your symptoms are episodic, your doctor may recommend a longer monitoring period with a portable device to catch what a standard ECG might miss.
ECG Waveforms Explained: P Waves, QRS Complex, and T Waves
Each heartbeat on an ECG produces a distinct set of waves, and learning to recognise them is the foundation of understanding ECG waveforms. The three main components — the P wave, the QRS complex, and the T wave — correspond to specific events in the heart's electrical cycle.
- P wave: The small rounded bump at the start of each cycle, showing the upper chambers (atria) squeezing blood into the ventricles.
- QRS complex: The sharp, tall spike that follows, representing the ventricles contracting to push blood to the lungs and the rest of the body.
- T wave: The smoother hill after the spike, reflecting the ventricles resetting electrically for the next beat.
The QRS complex is often the most visible part of the tracing because the ventricles are the most muscular chambers and generate the strongest electrical signal. The width and height of this complex tell cardiologists how efficiently the signal is travelling through the ventricular muscle. A narrow, crisp QRS suggests the signal is moving through normal pathways, while a widened complex may indicate that the signal is taking a detour — sometimes due to a block in one of the heart's conduction fibres.
The P wave is smaller and sometimes easy to overlook, but it carries important information. If the P wave has an unusual shape or is missing entirely, it may signal that the electrical impulse did not originate in the sinoatrial node as expected. Atrial flutter, for example, produces a distinctive sawtooth pattern of rapid P waves because the atria are beating much faster than the ventricles can follow. Recognising these patterns allows your cardiologist to pinpoint where the electrical system is behaving differently than it should, making accurate ECG interpretation possible.
What Does the ST Segment on an ECG Mean?
The ST segment is the flat section between the end of the QRS complex and the beginning of the T wave. Although it looks unremarkable — just a short stretch of flat line — this segment is one of the most closely scrutinised parts of the entire ECG. It represents the brief pause after the ventricles have contracted but before they reset for the next beat, and its position relative to the baseline can reveal whether the heart muscle is receiving enough blood.
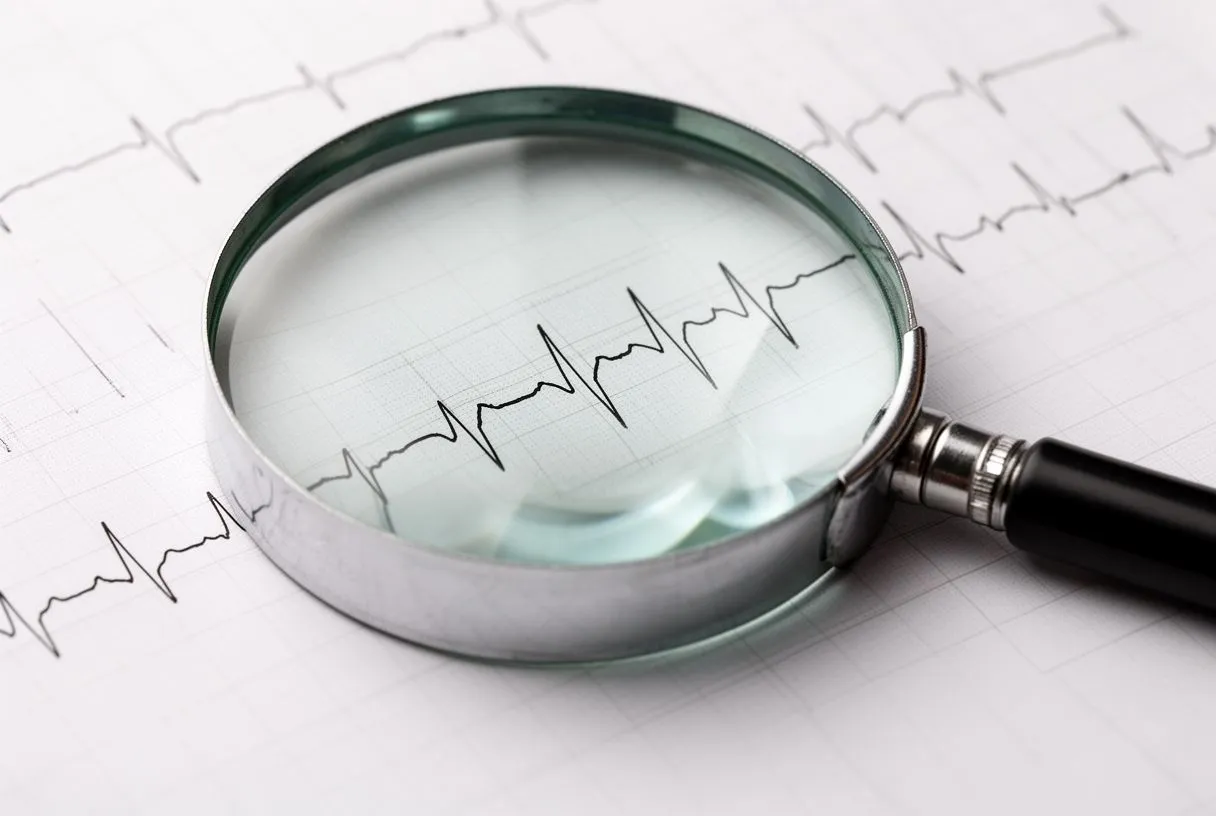
When the ST segment sits above or below the baseline, cardiologists refer to it as ST elevation or ST depression. ST elevation can indicate that a coronary artery is fully blocked and heart muscle is actively being damaged — this is what doctors call a STEMI, and it requires emergency treatment. ST depression, by contrast, often suggests reduced blood flow that may not yet be causing permanent damage but still warrants urgent investigation. Both findings change how quickly your medical team needs to act.
When ST changes are not a heart attack: Electrolyte imbalances, inflammation of the heart lining, certain medications, and even normal variations in young athletes can shift the ST segment. This is why a single ECG finding is never interpreted in isolation. Your cardiologist considers your symptoms, medical history, and sometimes compares current and previous tracings to determine whether an ST change is meaningful or simply a normal variant for you.
Understanding the QT Interval on Your ECG Report
What the QT interval actually measures: The QT interval spans from the start of the QRS complex to the end of the T wave — essentially, the total duration of ventricular electrical activity from activation through recovery. This interval matters because if it is too long, the heart becomes vulnerable to dangerous arrhythmias. A prolonged QT interval can be inherited, but it is more commonly caused by medications, electrolyte disturbances, or underlying conditions that affect how the heart's cells reset between beats.
Certain medications — including some antibiotics, antifungals, and psychiatric drugs — are known to lengthen the QT interval. If you are taking Aspirin for cardiovascular protection, this generally does not affect the QT interval, but other concurrent prescriptions might. Your cardiologist will review your full medication list when interpreting this measurement, because what appears abnormal on the tracing may be an expected effect of a drug that can be adjusted or replaced. The corrected QT interval, written as QTc, accounts for heart rate so that measurements at different rates can be compared fairly.
For patients with a family history of sudden cardiac events, the QT interval takes on added significance. An inherited condition called long QT syndrome can go unnoticed until an ECG happens to capture the prolongation. If your report flags a long QTc, your cardiologist may recommend genetic testing, a review of all medications, and possibly a consultation with a specialist in inherited heart conditions before deciding on the most appropriate next steps.
Normal ECG vs Abnormal: Key Differences Explained
The distinction between a normal and abnormal ECG is not always a sharp line. Cardiologists look at multiple features together — rate, rhythm, intervals, wave shapes, and segment positions — to build a complete picture. A tracing that shows a slightly fast heart rate might be normal if you were anxious during the test, but the same rate in a calm, resting patient would prompt further questions. Context is everything when comparing normal ECG vs abnormal findings.
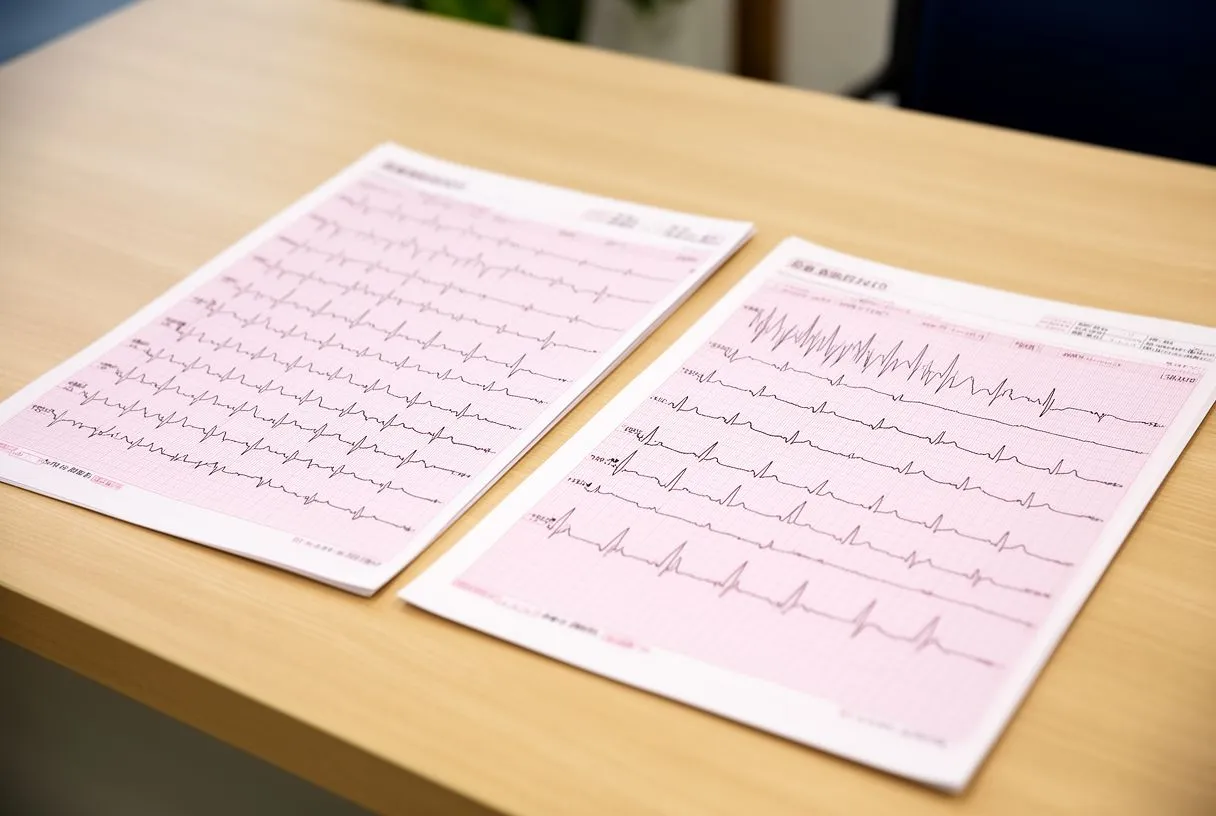
Specific findings that push an ECG into the abnormal category: These include rhythm disturbances such as atrial fibrillation or frequent premature ventricular contractions, evidence of a current or previous heart attack seen in the ST segment or Q waves, signs of thickened heart muscle from long-standing high blood pressure, and conduction delays such as bundle branch blocks. Each of these findings has different implications, and some are far more urgent than others.
Perhaps the most important thing to understand is that an abnormal ECG is a signal to investigate further, not a diagnosis in itself. Many people live with minor ECG abnormalities that never cause symptoms or require treatment. Conversely, a normal ECG does not guarantee a healthy heart if you are experiencing concerning symptoms. Your cardiologist weighs the tracing alongside your story, physical examination including auscultation — listening to your heart with a stethoscope — and sometimes additional imaging before reaching a conclusion.
What Can an Abnormal ECG Show About Your Heart?
An abnormal ECG can point to a wide range of cardiac conditions, some of which need immediate attention and others that can be managed over time. The tracing acts as a window into the heart's electrical system and, indirectly, into the health of the muscle itself and the blood vessels that supply it.
- Arrhythmias: Irregular rhythms such as atrial fibrillation or ventricular tachycardia, where the heart beats too fast, too slow, or in an uncoordinated pattern.
- Ischaemia: Reduced blood flow to the heart muscle, often shown by ST segment changes, which may indicate a partially blocked coronary artery.
- Prior heart attack: Deep Q waves or persistent ST changes that show where heart muscle was previously damaged and has scarred.
- Structural changes: Signs of an enlarged left ventricle or thickened heart wall from chronic hypertension or valve disease.
Systemic conditions also leave their mark on the ECG. Diabetes, for example, increases the risk of coronary artery disease and can produce subtle ECG changes even before symptoms appear. Research documented in a pooled analysis of 751 population-based studies with 4·4 million participants has shown the condition's growing burden on cardiovascular health globally, reinforcing why doctors pay close attention to ECG findings in diabetic patients. In rare cases of severe arrhythmia detected on ECG, an Automated External Defibrillator may be needed to restore a normal rhythm while definitive treatment is arranged.
Some ECG findings require urgent action, while others call for scheduled follow-up. ST elevation, a new bundle branch block with chest pain, or sustained ventricular tachycardia are emergencies. Chronic ST changes, mild interval prolongation, or borderline axis deviations may need a planned work-up with echocardiography, stress testing, or longer rhythm monitoring. Your cardiology team determines urgency based on the specific pattern and your overall clinical picture.
How to Read Your ECG Report: What the Numbers Mean
When you look at a printed ECG report, you will see a series of measurements alongside the tracing itself. These numbers — heart rate, intervals, and axis — are the quantitative summary of what the waves show visually. Heart rate is usually expressed in beats per minute, and most reports flag it as normal between 60 and 100 at rest. The PR interval measures the time the signal takes to travel from the atria to the ventricles, with a normal range typically between 120 and 200 milliseconds.
Standardisation of these measurements allows comparisons across different machines and over time. The same principles that guide consistent reporting in other areas of cardiovascular science — much like the minimal information standards described in the MISEV2023 framework — apply to ECG reporting, where consistent methodology ensures that findings from one clinic can be understood reliably by another. Your report may also mention the cardiac axis, which describes the general direction of the heart's electrical activity. A normal axis falls between -30 and +90 degrees, and deviations can point to enlargement or conduction issues in specific parts of the heart.

Why automated computer readings can mislead: The interpretive statement at the bottom of the report — sometimes called the computer-generated impression — can be misleading if taken at face value. These automated readings are a screening aid, not a final diagnosis. They can flag normal variants as abnormal or miss subtle patterns that a trained cardiologist would catch. Always review the report with your cardiac team rather than relying on the computer interpretation alone, especially if you have symptoms that do not match what the machine suggests.
When Should You Discuss ECG Results With a Cardiologist?
Any ECG result that mentions abnormal findings, borderline measurements, or recommendations for follow-up warrants a conversation with a cardiologist. Even if the tracing is described as normal, persistent symptoms such as chest discomfort, palpitations, dizziness, or exercise intolerance should be discussed in person. The ECG is one piece of the diagnostic puzzle, and your lived experience matters just as much as what the paper shows.
For patients considering cardiac surgery or intervention — whether that involves a balloon angioplasty for a narrowed artery, a procedure on the ascending aorta, or evaluation before valve surgery — the ECG provides baseline information that helps your surgical team assess risk and plan appropriately. If you are travelling to Guadalajara, Querétaro, or Hermosillo for cardiac care, bringing previous ECG tracings with you allows the team to compare old and new findings, which can reveal changes that a single snapshot cannot capture on its own.
Understanding your ECG results is the beginning of an informed conversation, not the end of one. We encourage you to bring your questions, your report, and your symptoms to a consultation with a qualified cardiac team. Dr Alejandro Molina and the specialists at Cirugía de Corazón are here to review your tracing in the context of your full medical history and help you decide on the most appropriate next step for your situation. Rather than self-diagnosing from a printout, book a consultation so that your ECG results are explained in relation to your unique cardiac health.