

Echocardiogram Results Explained: Valves, Pumping, Pressures
Echocardiogram results explained clearly by Guadalajara heart specialists.
Walking out of an echo lab clutching a report filled with abbreviations and numbers leaves many patients and families uncertain about what comes next. When your doctor says they will schedule an echocardiogram, the test itself feels straightforward—gel on the chest, an ultrasound probe, images on a screen. Yet the real moment of vulnerability often arrives days later, when the printed report lands in your hands or appears in a patient portal before anyone has walked you through it. Echocardiogram results explained in plain language matter because this single study shapes decisions about medications, procedures, and how closely you need follow-up. At Cirugía de Corazón, we believe understanding your echo empowers you to ask sharper questions and participate more fully in your care.
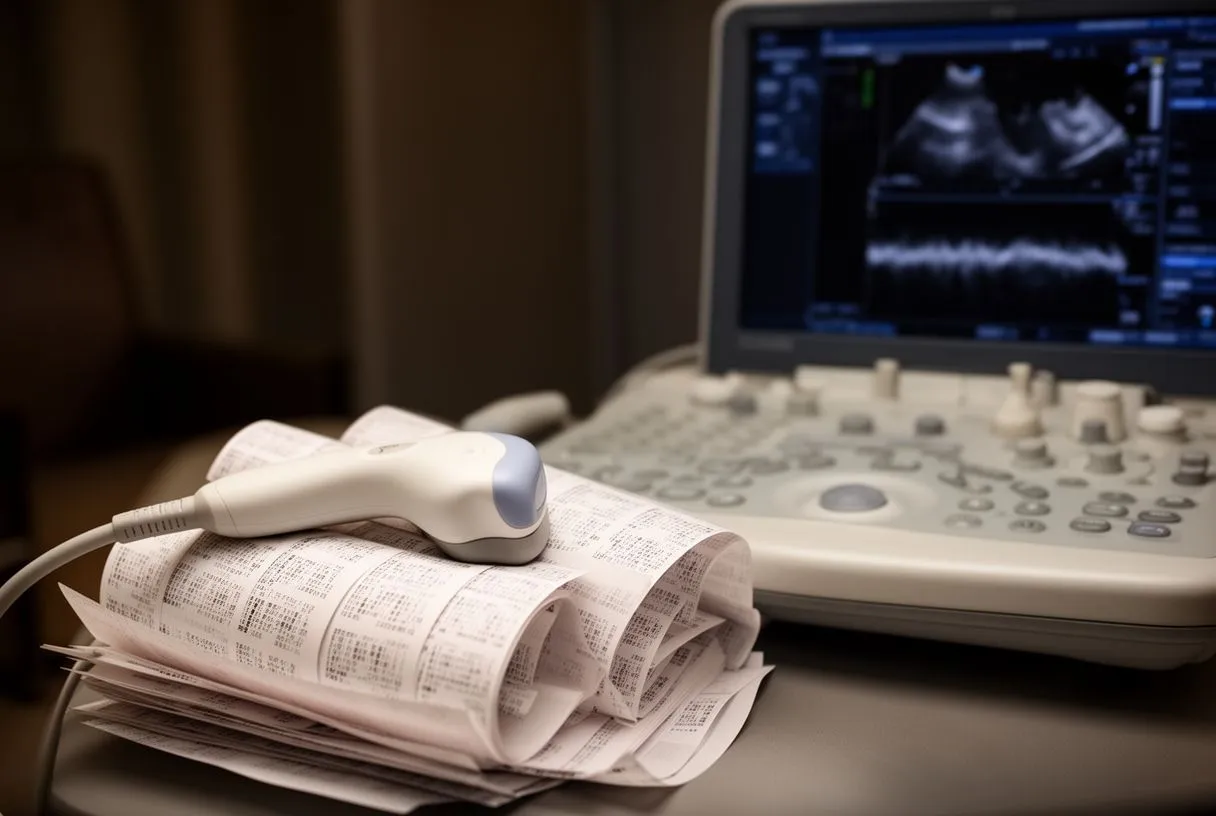
An echocardiogram is essentially an ultrasound of the heart. Sound waves bounce off cardiac structures and return as live images that reveal how your heart muscle contracts, how valves open and close, and how blood flows through chambers and great vessels. The interpreting cardiologist measures specific structures, calculates derived values, and compares everything against normal ranges adjusted for your body size and age. No single number tells the whole story; the report weaves together multiple observations into a clinical impression that guides your treatment plan.
If you have had echocardiograms before, bring the prior reports to your consultation. Bringing your actual report—not just a verbal summary—allows your doctors to track changes over time and decide whether repeat imaging would add useful information.
What Are Echocardiogram Results Explained?
Put simply, echocardiogram results explained means translating the technical findings of your heart ultrasound into actionable understanding about your cardiac health. The report contains objective measurements, descriptive assessments, and a concluding interpretation that synthesizes everything into a diagnostic statement. Knowing which sections carry what information helps you navigate the document without feeling overwhelmed by terminology.
Structural measurements form the foundation of every report. The sonographer measures wall thicknesses, chamber dimensions, and the diameter of the Aortic Root Aneurysm territory if dilatation is present. These linear measurements appear in millimeters and are indexed to body surface area when relevant. A left ventricular wall measuring more than 11 mm in diastole, for instance, suggests hypertrophy that warrants investigation for chronic pressure overload or infiltrative conditions. The Ascending Aorta is measured at standard levels because progressive dilation here raises concern for Aortic Dissection risk—particularly when associated with bicuspid valve anatomy or connective tissue disorders.
Functional assessments describe how structures perform rather than simply how they appear. This includes quantification of pumping strength, valve motion dynamics, and the characteristics of blood flow across structures. The interpreting physician integrates these elements with your symptoms, physical examination, and other studies to formulate clinical recommendations. A technically adequate study performed in a stable patient can reveal remarkable detail, yet echo findings must always sit within the broader clinical context.
The concluding impression ties findings to diagnoses. Rather than leaving you with a list of numbers, the cardiologist states whether the study is normal, what abnormalities are present, and often suggests severity grading that shapes management. This synthesis determines whether you need surveillance, medication adjustment, or referral for interventional procedures.
How Echocardiogram Valves Work on Your Report
Your heart contains four valves—two on the right side (tricuspid and pulmonary) and two on the left (mitral and aortic)—that ensure blood flows in one direction through the cardiac chambers. On echo, each valve is assessed for structure, motion, and the presence of regurgitation or narrowing. The terminology can feel foreign, but the concepts are accessible once mapped to what the ultrasound actually shows.
Valve structure appears in the morphologic description. Leaflets may be described as thin and pliable versus thickened, calcified, or prolapsing. The mitral valve, positioned between the left atrium and left ventricle, receives particular attention because abnormalities here commonly produce symptoms. Thickening at the leaflet edges with restricted opening suggests rheumatic involvement still seen in some populations. Myxomatous change with redundant tissue creates prolapse, where leaflets billow back into the atrium during contraction. A bicuspid Aortic Valve—present from birth with only two leaflets instead of three—predisposes to early Aortic Stenosis and requires lifelong surveillance.
At the Apex of the Heart, the ultrasound probe captures apical views that display all four valves in coordinated motion. From this position, Doppler interrogation measures the velocity of blood traveling through each valve orifice. Higher velocities across a narrowed valve translate to larger pressure gradients, which the report converts into severity estimates.
Color Doppler maps regurgitant jets in real time. When a valve fails to seal completely, blood leaks backward—termed regurgitation or insufficiency. The echocardiogram characterizes these jets by their size, shape, and penetration into the receiving chamber. Central jets differ from eccentric wall-hugging jets in how they are quantified. The vena contracta width, defined as the narrowest portion of the regurgitant stream just below the leaking valve, provides one validated measure of severity. Larger vena contracta dimensions indicate more significant regurgitation that more often drives symptoms and warrants intervention.
Types of Echocardiogram Pumping Function Measurements
Pumping function—how effectively your heart delivers blood to the body—represents one of the most consequential elements of any echo report. Multiple techniques exist to assess this, and modern reports often include several complementary measurements rather than relying on a single number.
Ejection fraction remains the most widely quoted metric. This percentage represents the proportion of blood ejected from the left ventricle with each contraction compared to the total volume present before contraction. A normal left ventricular ejection fraction typically falls between 55% and 70%. Values below 40% indicate systolic heart failure with reduced pumping capacity, while mid-range values between 41% and 49% define a gray zone associated with intermediate prognostic risk. The echocardiogram calculates ejection fraction through geometric assumptions (Simpson's biplane method) or, increasingly, through three-dimensional reconstruction that avoids shape-related errors.
Strain imaging detects subtler abnormalities before ejection fraction drops. This technique tracks how individual segments of heart muscle deform during contraction, expressed as a negative percentage. More negative values indicate better deformation; less negative or positive values reveal impaired mechanics. Global longitudinal strain, averaging deformation along the heart's long axis, identifies early cardiotoxicity from chemotherapy or infiltrative disease even when ejection fraction still appears normal. Cardiac amyloidosis, for instance, characteristically produces an apical-sparing strain pattern that experienced readers recognize.
Cardiac output measurement integrates multiple variables. The Doppler method multiplies the velocity-time integral of blood in the left ventricular outflow tract by the tract's cross-sectional area and heart rate. This yields liters per minute—a direct gauge of perfusion adequacy. Low output despite normal ejection fraction raises concern for valvular obstruction, severe regurgitation with inadequate forward flow, or chronotropic incompetence. High output states occur with anemia, thyrotoxicosis, or arteriovenous shunting.
Echocardiogram Pressures and What They Reveal
Blood pressure within heart chambers and pulmonary vessels provides crucial diagnostic and prognostic information. Echo estimates these pressures non-invasively using Doppler physics, avoiding the need for catheterization in many cases.
Left ventricular filling pressures reflect diastolic performance. When the left ventricle stiffens—whether from long-standing hypertension, age-related fibrosis, or infiltrative disease—it resists filling during the relaxation phase. Pressure rises in the left atrium to force blood inward, and this elevated pressure transmits backward into the pulmonary veins. Echo estimates the ratio of early filling velocity (E wave) to tissue Doppler velocity at the mitral annulus (e'), producing the E/e' ratio. Values exceeding 14 suggest elevated left ventricular filling pressures associated with dyspnea and adverse outcomes.
Pulmonary artery pressures are derived from tricuspid regurgitation jet velocity. The modified Bernoulli equation converts the peak velocity of blood leaking backward through the tricuspid valve into a pressure gradient, then adds an estimated right atrial pressure. Pulmonary hypertension—defined as mean pulmonary artery pressure above 20 mmHg at rest—carries significant implications for prognosis and treatment. Severe elevation raises concern for left heart disease, lung parenchymal or vascular disorders, or chronic thromboembolic disease requiring dedicated evaluation. The Atrial Septal Defect can produce left-to-right shunting that eventually reverses with pulmonary vascular remodeling.
Research on cardiovascular sequelae of infectious disease has expanded understanding of how systemic inflammation alters cardiac pressures. A systematic review in Nature Scientific Reports documented more than 50 long-term effects of COVID-19, including persistent abnormalities in cardiac function and hemodynamics that echo surveillance helps characterize.
Ejection Fraction Results: What Numbers Mean for You
Among all echo measurements, ejection fraction results provoke the most patient anxiety and the most clinical attention. Understanding what this number actually represents—and what it does not—prevents both false reassurance and unnecessary worry.
A preserved ejection fraction does not guarantee normal heart function. Patients with heart failure with preserved ejection fraction (HFpEF) experience typical symptoms—shortness of breath, exercise intolerance, fluid retention—despite measurements above 50%. The ventricle stiffens and fails to relax appropriately during diastole; the atrium compensates until it too decompensates. Echo identifies this pattern through abnormal diastolic indices, left atrial enlargement, and elevated filling pressures despite normal systolic metrics. HFpEF now represents at least half of all heart failure admissions and poses particular therapeutic challenges.
Reduced ejection fraction triggers evidence-based interventions. Below 40%, guideline-directed medical therapy including beta-blockers, renin-angiotensin-aldosterone system inhibitors, and mineralocorticoid receptor antagonists improves survival and reduces hospitalization. Device therapy with implantable defibrillators becomes appropriate below 35% in selected patients for primary prevention of sudden death. Cardiac resynchronization therapy benefits those with reduced ejection fraction and conduction delay evidenced by prolonged QRS duration. These thresholds emerge from randomized trials and represent hard clinical decision points.
For surgical planning, ejection fraction results influence procedural risk stratification. Low ejection fraction elevates calculated risk scores and may prompt consideration of less invasive approaches. In Aortic Valve replacement, for instance, profoundly reduced ventricular function shifts the risk-benefit balance toward transcatheter procedures rather than conventional open surgery in appropriate anatomical candidates.

Valve Regurgitation Echo: Grading and Clinical Meaning
Regurgitation severity grading determines surveillance intervals, symptom thresholds, and timing of intervention. The echo report classifies each regurgitant lesion as trace, mild, moderate, or severe using integrated multiparametric approaches rather than single measures.
Mitral regurgitation carries substantial hemodynamic consequences when severe. The left ventricle faces volume overload as it must pump both the normal forward stroke volume and the regurgitant volume back into the atrium. Chronic compensated dilation eventually yields decompensation with rising filling pressures and declining forward output. Echo quantifies regurgitant volume and fraction; severe disease exceeds 40 mL regurgitant volume or 40% regurgitant fraction. Left ventricular end-systolic dimension above 40 mm or ejection fraction below 60% indicates ventricular decompensation that warrants surgical consideration even without symptoms.
Primary mitral regurgitation—due to structural leaflet or chordal abnormality—differs fundamentally from secondary regurgitation, where normal leaflets fail to coapt because of ventricular or annular remodeling. This distinction drives treatment selection: primary lesions often benefit from repair, while secondary regurgitation requires addressing the underlying ventricular dysfunction, with transcatheter edge-to-edge repair emerging for selected inoperable patients.
Aortic Regurgitation produces combined volume and pressure overload. The left ventricle dilates to accommodate the regurgitant volume while wall stress rises. Over years, this produces eccentric hypertrophy with increased chamber size and wall thickness. Severe chronic Aortic Regurgitation warrants surgery when the left ventricular end-systolic dimension exceeds 55 mm or ejection fraction falls below 50%, even in asymptomatic patients, because postoperative recovery becomes unpredictable beyond these thresholds. Acute severe regurgitation—as from Aortic Dissection or infective endocarditis—represents a cardiovascular emergency requiring urgent intervention regardless of dimensions.
Diastolic Function Echo: When the Heart Relaxes
Systole—contraction—receives disproportionate attention because it is easier to conceptualize and measure. Yet diastolic function, the period of ventricular relaxation and filling, consumes more of the cardiac cycle and proves equally essential to overall performance. Abnormal diastolic function echo findings explain symptoms in numerous patients with seemingly normal ejection fraction.
The diastolic phases include isovolumetric relaxation—after the Aortic Valve closes but before the mitral valve opens—followed by early rapid filling driven by the pressure gradient between atrium and ventricle, and finally atrial contraction contributing the remaining ventricular volume. Echo characterizes each phase through spectral Doppler of transmitral flow, tissue Doppler of mitral annular motion, and pulmonary venous flow patterns.
Impaired relaxation represents the earliest diastolic abnormality. The left ventricle loses elastic recoil; early filling diminishes while atrial compensation increases. Transmitral Doppler shows reduced E wave velocity, increased A wave velocity, and consequently decreased E/A ratio below 0.8. This pattern, common with aging and hypertension, typically does not elevate filling pressures at rest. However, exercise or volume loading may unmask limitation, explaining exertional dyspnea despite normal resting studies.
Restrictive physiology indicates advanced disease with poor prognosis. Markedly elevated filling pressures produce tall E waves with rapid deceleration and diminished A waves as the atrium fails against a stiff ventricle. The E/e' ratio rises substantially, and pulmonary venous Doppler shows prominent systolic flow reversal. This pattern appears in advanced infiltrative cardiomyopathy, restrictive cardiomyopathy from fibrosis, and end-stage dilated cardiomyopathy. When irreversible, cardiac transplantation becomes the definitive therapeutic option.
- Grade I (impaired relaxation): E/A ratio below 0.8, normal e' velocity, normal E/e' ratio. Seen with aging, hypertension. Usually no elevated filling pressures at rest.
- Grade II (pseudonormal): E/A ratio 0.8–1.5 with reduced e' velocity and elevated E/e' ratio. Requires Valsalva maneuver or pulmonary venous flow to distinguish from normal.
- Grade III (restrictive, reversible): E/A ratio above 2.0, markedly reduced e', elevated E/e' ratio. May improve with diuresis or treatment of underlying cause.
- Grade IV (restrictive, irreversible): Same Doppler pattern as Grade III but unchanging despite interventions. Associated with poor prognosis and advanced structural disease.
Normal Echocardiogram Values and Reference Ranges
Interpreting your report requires knowing what "normal" actually means for each measurement. Reference ranges derive from population studies and are indexed to body surface area when appropriate, meaning a value normal for a petite individual may be abnormal for someone larger.
Left ventricular dimensions illustrate this principle. Normal end-diastolic diameter ranges from 42 to 58 mm in men and 38 to 52 mm in women; indexing to body surface area tightens interpretation. Wall thickness at the septum and posterior wall normally measures 6 to 10 mm; values above 11 mm define hypertrophy. The left atrium enlarges with chronic pressure or volume overload; normal volume index stays below 34 mL/m². Progressive left atrial dilation correlates with atrial arrhythmia risk including Atrial Flutter and fibrillation, and with thromboembolic complications that prompt anticoagulation consideration.
Aortic dimensions demand precise measurement and trending. The Aortic Root Aneurysm territory—comprising the sinus of Valsalva, sinotubular junction, and proximal Ascending Aorta—normally measures below 40 mm in most adults. Bicuspid valves and inherited connective tissue disorders produce faster dilation rates. Surgical thresholds integrate absolute dimension, rate of growth, family history of Aortic Dissection or Aortic Rupture, and associated valvular disease. The guideline threshold of 5.5 cm for elective intervention in uncomplicated cases drops to 5.0 cm with bicuspid valve or family history, and lower still for Marfan syndrome.
Right heart structures have their own reference ranges. The right ventricle is more challenging to image because of its anterior position and complex geometry, but basal diameter normally stays below 41 mm and longitudinal function—measured by tricuspid annular plane systolic excursion or fractional area change—provides prognostic value. The inferior vena cava diameter and its collapsibility with inspiration estimate right atrial pressure, a key component of pulmonary artery pressure calculation.
Echocardiogram Report Guide: Reading Sections in Order
A systematic approach to reading your echocardiogram report prevents fixation on single abnormal numbers while missing the integrated clinical picture. Most reports follow a predictable structure that, once learned, permits efficient navigation.
Begin with the technical quality statement. Reports indicate whether image quality was adequate for full interpretation or whether acoustic windows were suboptimal, potentially limiting assessment. Body habitus, lung disease, and prior surgery degrade windows; contrast enhancement with intravenous microbubbles may improve endocardial border definition. A technically limited study may require repeat imaging with alternative approaches or complementary magnetic resonance imaging.
Review measurements in their anatomical sequence: left ventricle first, then left atrium, aortic valve and root, mitral valve, right ventricle, tricuspid valve, pulmonary valve, and pulmonary pressures. This mirrors how the cardiologist structurally surveys the heart. Abnormalities flagged here receive elaboration in the descriptive sections that follow. Pay attention to whether measurements are absolute or indexed; indexed values permit comparison across body sizes.
The Doppler section presents flow velocities and derived pressures. Color Doppler findings describe regurgitation location and qualitative severity; spectral Doppler provides quantification. Tissue Doppler velocities at the mitral annulus characterize both systolic and diastolic function. These measurements interrelate: elevated filling pressures elevate E/e' ratio and pulmonary venous systolic flow reversal simultaneously.
The impression section synthesizes findings into coherent diagnoses. Rather than listing isolated abnormalities, it states whether study is normal, what structural or functional abnormalities are present, their severity, and how they likely relate to your clinical presentation. Comparisons with prior studies demonstrate progression or stability. When the impression states "consistent with" or "suggestive of," it indicates appropriate diagnostic hedging based on available information.
Are Echocardiogram Results Explained by Your Cardiologist Enough?
Even when your cardiologist explains results thoroughly, many patients benefit from additional time, written summaries, and opportunity for follow-up questions. The clinical encounter often feels compressed; complex findings deserve unhurried discussion.
Request clarification on anything unclear. Medical terminology that seems routine to your care team may be opaque to you. Ask what each diagnosis means for daily life, what symptoms would warrant earlier contact, and how frequently repeat evaluation is planned. Understanding whether your Aortic Stenosis is mild versus moderate versus severe changes surveillance intervals from years to months and alters exercise recommendations.
Seek comparison with prior studies when available. A single echo provides a snapshot; serial studies reveal trajectory. Stable mild regurgitation over five years reassures; new onset or progression toward severe regurgitation prompts intervention planning. Ask your doctor to request outside imaging for comparison rather than relying solely on verbal summaries of prior findings.
Consider second opinion for discordant findings. When echo results do not match your symptoms, when different readers disagree on severity, or when high-stakes decisions hinge on borderline measurements, repeat study at a specialized center may add clarity. Three-dimensional echocardiography, transesophageal imaging with the probe positioned behind the heart, or cardiac magnetic resonance imaging resolve uncertainty in selected cases. Research on Mechanisms of SARS-CoV-2 entry into cells published in Springer's portfolio illustrates how advanced imaging techniques continue refining our understanding of organ-level pathophysiology, including cardiac involvement in systemic disease.
Echocardiogram results explained well transform anxiety into understanding and passive receipt of information into active partnership. The report contains extraordinary detail about your heart's structure and function, but its value depends entirely on interpretation within your unique clinical context. At Cirugía de Corazón, the team welcomes patients seeking a second opinion about their prior studies. Whether you face newly diagnosed valve disease, declining pumping function, or simply desire thorough explanation of complex findings, our team in Guadalajara, Querétaro, and Hermosillo provides patient-centered interpretation aligned with current guideline standards. We encourage you to bring your actual reports, prepare your questions, and discuss your individual situation with our cardiac team to determine the most appropriate path forward for your specific circumstances.